If you click or tap on a technician's card or row in the technician dashboard, the information for that single technician loads. There are four tabs for each technician: Overview, Edit Profile, Skills, and Badges. This article will focus on the "Overview" tab. Follow the links below to read about the other tabs:
- Edit Profile
- Skills
- Badges
Summary Side Bar
First, look to the far right of the screen. You will see a quick summary on the sidebar there.

On this sidebar you can see:
- Profile picture
- Title
- Name
- Status (active vs. disabled)
- The number of completed work orders
- The number of withdrawn work orders
- The number of assigned work orders
- The number of callbacks
- Average completion time
- The top four skills based on work order completion

The work order breakdown also acts as a navigation menu for the graphs and data on the left side of the screen.
If you click or tap on "Completed" then the graph will show the technician's completed work orders, and the table will list the completed work orders, showing one month at a time.
If you click or tap on "Withdraw", the graph and table will switch to show data about withdrawn work orders from the technician.
The same for "Assigned" and "Callbacks".
The date filter defaults to showing the last six months of data. You can change this with the date filter.
Date Filter
Located at the top right of the graph, the date filter lets you change the time period from which the work order data is pulled.

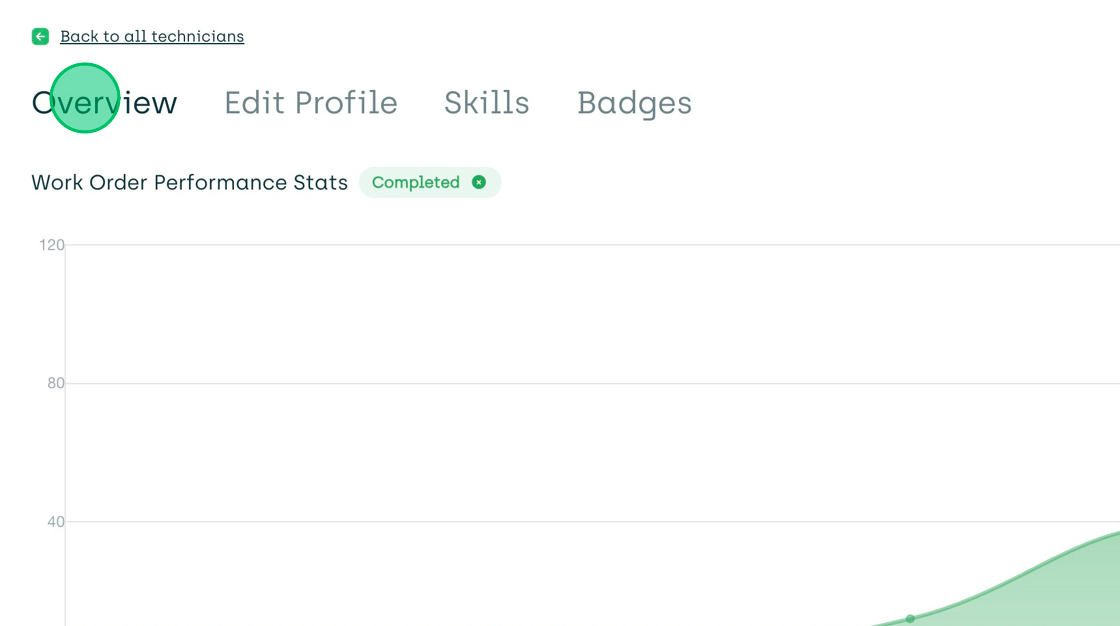
Work Order Graph
After selecting "Completed" and "Show: Last 3 Months" you will see a graph like the one below. Notice that you can hover at the data point of each month to see the number of work orders completed within that specific month.
Also, at the end of the graph, you can see the technician's average number of completed work orders per month, during the last three months. There is a dotted line crossing the entire graph that represents this average number.
If you select "Last 6 Months" in the data filter, then the average will be based on the numbers for the last six months instead.

Work Order Table by Month
When you change the date filter, you also change the available months of information in the table under the graph. If you have selected the last three months, then you will have three months to scroll through.
When scrolling through the months, the software displays a list of the actual work orders either completed, withdrawn from, assigned, or reopened. You can click or tap on the work order row in the table, and AppWork will take you to the page for that specific work order.
